Investing is hard.
We make it easier.
See the markets more clearly, improve your portfolio management, and find promising new opportunities faster than ever before.
Trusted by thousands of online investors across the globe, StockCharts makes it easy to create the web’s highest-quality financial charts in just a few simple clicks.
Create bigger, better, more advanced charts and save them to your account. Run custom scans to find new trades or investments, and set automatic alerts for your unique technical criteria. Plus, with daily market commentary from industry-leading technicians, you can follow the experts and see the latest charts they’re watching.
We only refer products we have confidence in. Martin has been aware of StockCharts since 2015, when he became their Chief Technical Strategist. Since then StockCharts has become a daily staple in his analysis. He believes the platform provides great value, as it offers multiple expert commentaries, an extensive database including many of his personal indicators as well as style sheets (templates) and chart lists (electronic chart books). As an educator he appreciates the ChartSchool, an extensive educational resource available to members and non-members alike.
ALL AT YOUR FINGERTIPS
Real-time charting, wherever you go.
The markets won’t stop because you’re away from your desk. You need a real-time charting platform that goes where you go – anywhere, anytime, on any device.
Built for the modern investor, StockCharts puts the industry’s best technical tools and resources at your fingertips, with no software to install or frustrating compatibility issues. Whether you’re on a desktop, laptop, smartphone or tablet, access everything in your account seamlessly from any web-enabled device.
Over 1.6 million investors trust StockCharts.com to deliver the tools and resources they need to invest with confidence.
DESIGNED TO DO MORE
A complete toolkit for every stage of your investing process.
Whether you’re an active trader or simply managing your retirement accounts, StockCharts has everything you need to plan, organize and execute any investing system. This is your complete analysis and portfolio management toolkit.
- Discover the market’s most promising new opportunities with our advanced scanning tools.
- Pinpoint the perfect entry with our award-winning charting and annotation tools.
- Monitor your open positions and track your portfolios with ChartLists.
- And when it comes time to sell, our custom technical alerts will help you time your exits like a pro.
YOUR COMPLETE TRADING TOOLKIT
Built to empower the modern investor.
Award-Winning Charting
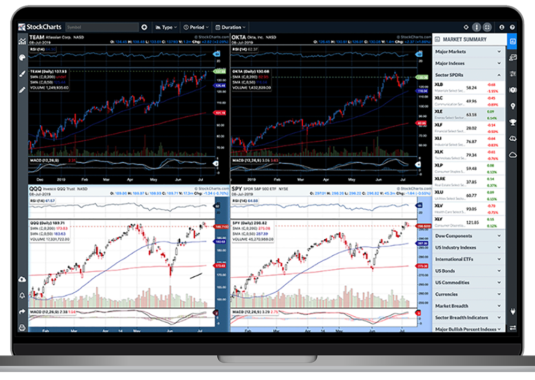
Create larger, more advanced charts with real-time intraday data, more indicators and overlays, auto refresh and much more. Save your charts, settings and annotations, create and organize ChartLists to make managing your portfolio a breeze, and access everything from your desktop, laptop, smartphone or tablet.
ChartLists
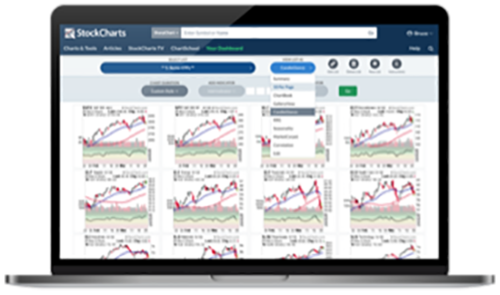
Save and organize the charts you’re watching with custom ChartLists. View your charts in a variety of formats, including Summary view with latest performance data, 10 per Page with your own custom ChartStyles, ChartBook, CandleGlance, GalleryView and many more. With everthing saved to your StockCharts account, you can access your charts anywhere, anytime, from any device.
The Members Dashboard
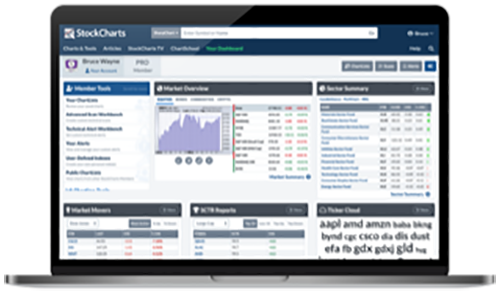
The heart and soul of your StockCharts account, the Members Dashboard features a customizable layout that can be tailored to fit your needs. Follow the day’s market movers, stay on top of your portfolio with quick access to your ChartLists, and run your custom scans in a single click.
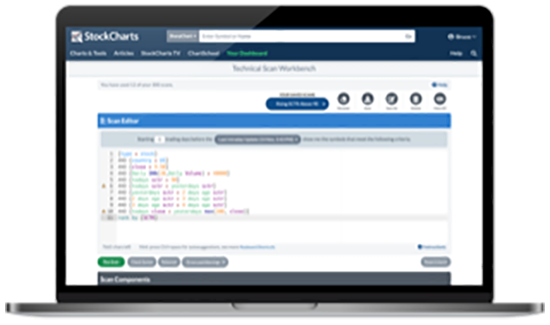
Advanced Technical Scanning
Instantly find stocks and funds that meet your specific technical criteria with our custom scanning tools. Run your scans on over 50,000 symbols in our database to help streamline your investing workflow and discover new, promising opportunities.
Custom Alerts
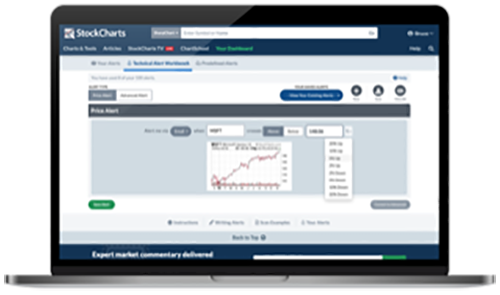
Create custom technical alerts and stay ahead of important moves with email, SMS and web notifications. Whether it’s a simple price cross or an advanced combination of indicator triggers, our alert features will make sure you never miss a thing.
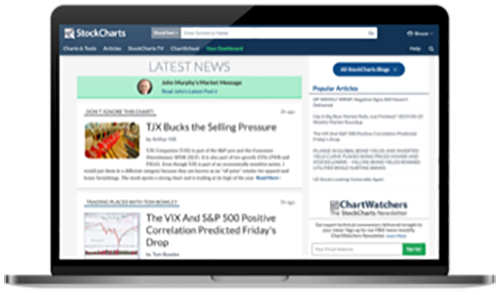
Expert Market Commentary
Unlock market commentary from industry experts, such as John Murphy, Martin Pring and Arthur Hill. See the markets through their eyes and follow exactly what they’re seeing on the charts.
MORE FEATURE HIGHLIGHTS
The web’s best collection of technical tools and resources,
all at your fingertips.
SharpChartsOur award-winning charting tool allows you to create, annotate, save and share your own advanced financial charts |
Point & Figure ChartsThe old-school charts with Xs and Os that automatically filter out financial market noise |
PerfChartsDynamically compare the performance of up to 10 different ticker symbols on the same chart |
Seasonality ChartsSee monthly price performance trends for the stocks or funds you’re watching over an adjustable time period |
GalleryViewAutomatically chart the same symbol in multiple timeframes to allow for simultaneous short-, mid-, and long-term analysis |
CandleGlanceView all the charts in any of your saved ChartLists all at once as mini-charts displayed side-by-side on a single page |
RRG ChartsChart relative strength and momentum for a group of securities, tracking their rotations to find important pivot points |
MarketCarpetsVisually scan large groups of securities or your ChartLists to catch emerging trends and interesting technical moves |
Dynamic Yield CurveA draggable, interactive chart that shows the relationship between interest rates and stocks over time |
Sector SummaryDrill down into the market’s sectors to quickly find the industry groups and stocks that are outperforming |
SCTR ReportsOur unique technical ranking system that allows you to quickly and easily determine a stock or fund’s relative strength |
Predefined ScansAccess our extensive set of predefined technical scans, making it easy to filter the market for promising opportunities |
Predefined AlertsSee what’s moving the markets and find important charts to watch by following our predefined technical alerts |
Public ChartListsShare your chart annotations, market commentary and latest trading ideas among the global network of StockCharts users |
User-Defined IndexesCreate your own personal stock indexes, then chart that data on a SharpChart just like any other official index |
Historical Chart GalleryA complete collection of long-term, large-format charts, allowing for detailed study of historical market movements |
ChartPacksStart charting like a pro by adding these helpful, pre-formatted ChartLists to your account in just a few clicks |
ChartSchoolOur extensive educational resource, designed to help you learn more about investing, trading and technical analysis |

