Confidence ratios can be very helpful in identifying changes in investor sentiment in bonds, stocks and commodities. This article focuses on the credit markets where changes in spreads between differing credit qualities reflect swings in risk appetite.
Generally speaking, when investors grow more confident it’s because they are expecting economic conditions to improve. That almost certainly means that concerns involving corporate bond defaults are being downplayed and vice versa. These swings in sentiment can be tracked by comparing the performance between good quality and poorer quality bonds. When investors bid up the prices of junk bonds relative to high quality governments, it means they’re willing to accept a greater risk in order to enjoy those juicy yields. Alternatively, when they are concerned about the future, these same investors are willing to accept a lower yield as the price for greater safety. Under such circumstances, they emphasize government bonds over poorer quality ones.
There are many ways these credit spreads are expressed. One example is the ratio between the iShares iBoxx $ High Yield Corporate Bond ETF (HYG) to the iShares 20+ Year Treasury Bond ETF (TLT), a relationship that is regularly featured in the InterMarket Review (IMR). However, these instruments have only a limited history going back to the start of the current century. At Pring Research, we like to study data series over considerably longer periods of time, which is why we also use the relationship between the yield o 20-year Treasury bonds and Moody’s Seasoned Baa Corporate Bond Yield (BAA) series, as it’s possible to trace it back to the start of the twentieth century. Baa rated instruments, it should be noted, are actually of investment, as opposed to junk grade. Nevertheless, the relationship still works well from the point of view of identifying major swings in confidence, and therefore changes in the trend of interest rates.
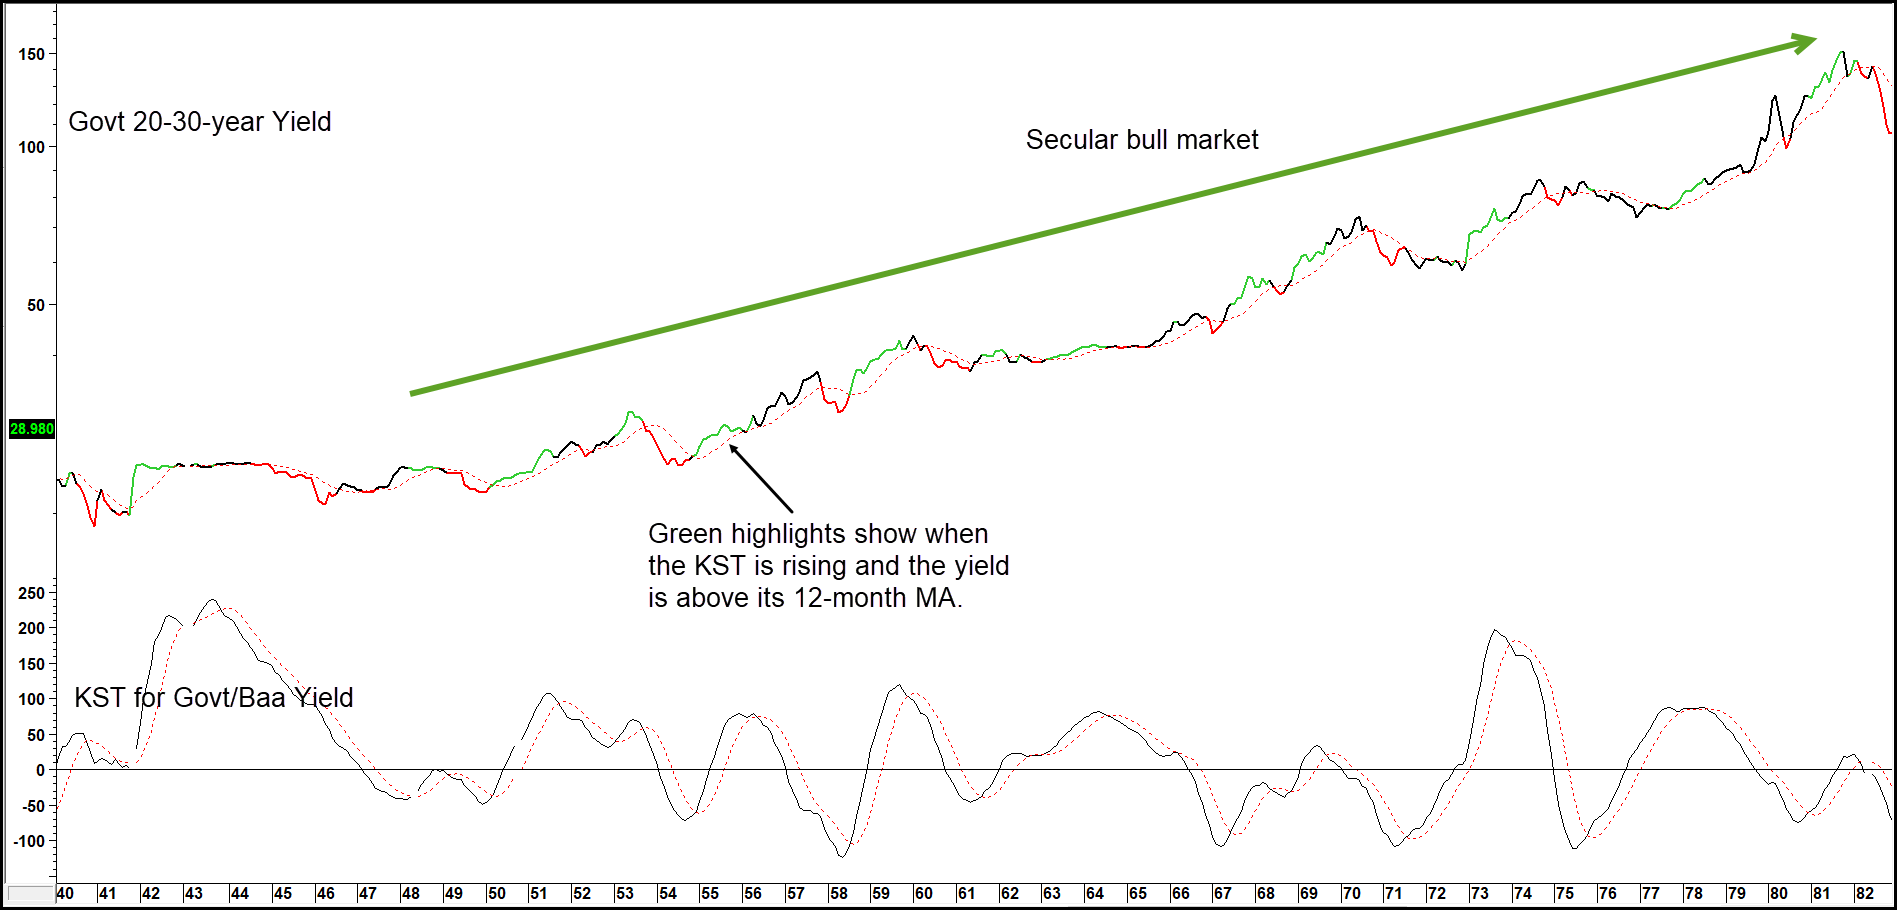
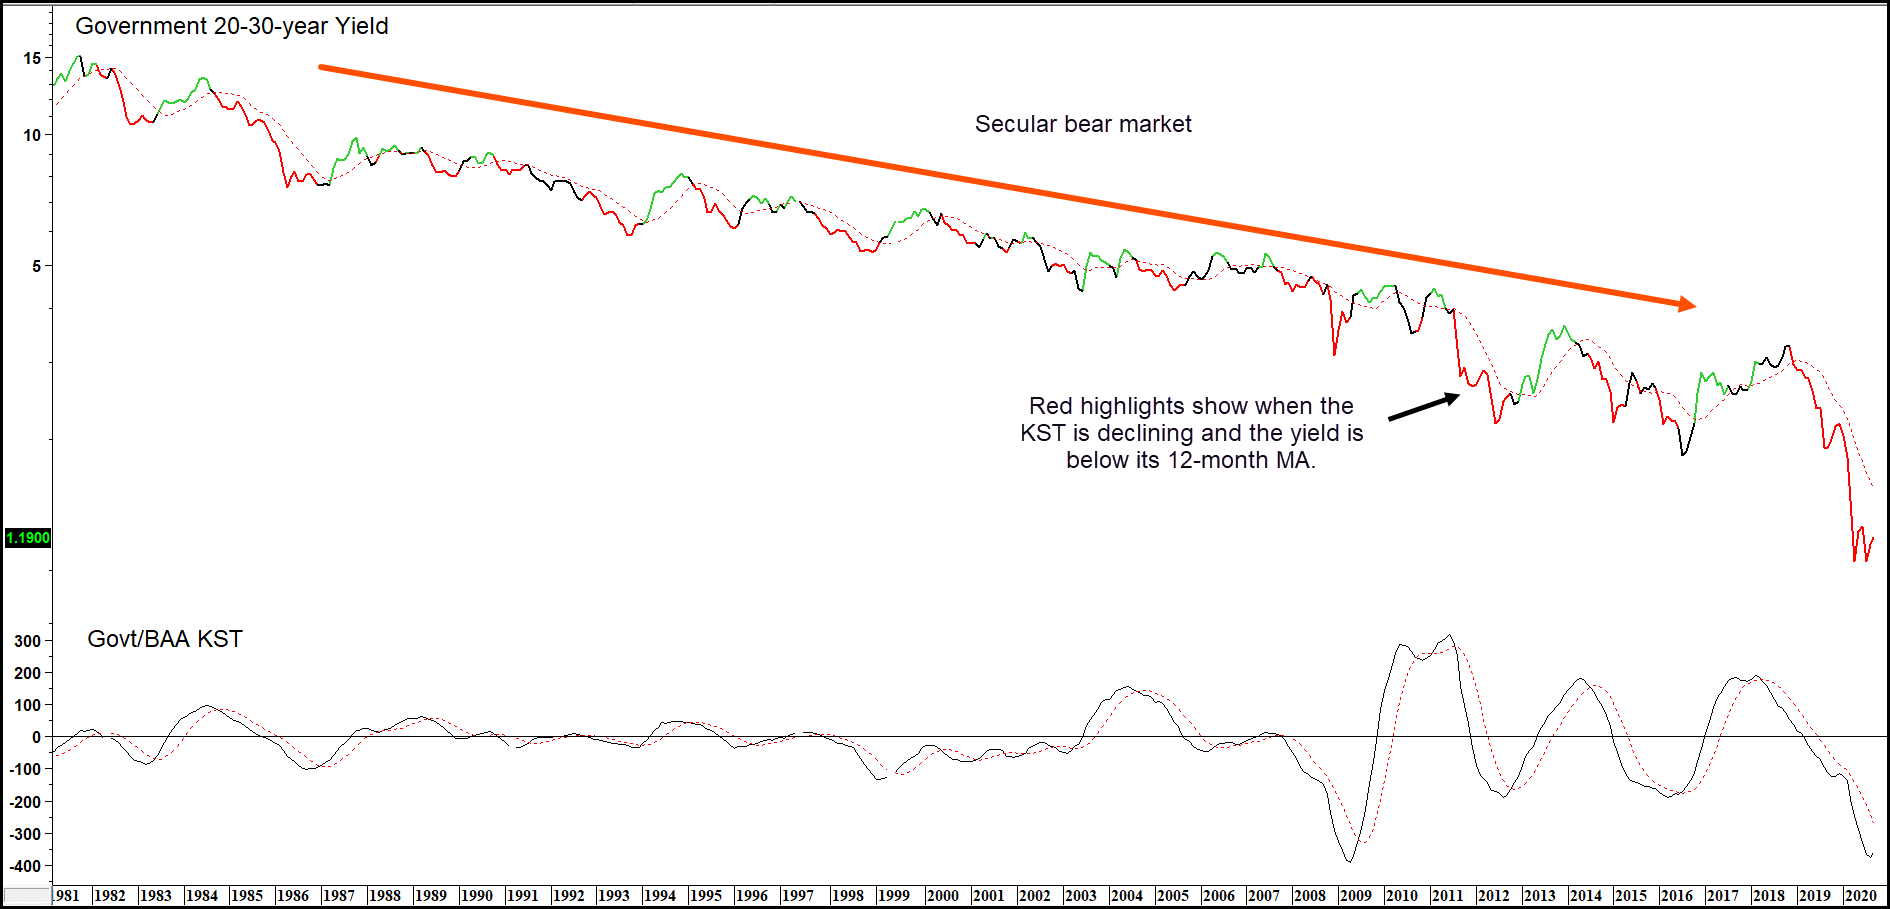
This data is cyclical in nature, so it’s best plotted in long-term smoothed momentum format. We choose to use the KST as our vehicle in Charts 1 and 2. Chart 1 covers the post war secular, or very long-term trend of rising rates. Chart 2 embraces the secular bear market in yields that began in 1981. A rising KST means that Baa yields are under performing their government counterparts and vice versa. Since prices move inversely to yields, it also implies that Baa prices are stronger than governments. That means a rising ratio underscores improving confidence. Green highlights indicate when credit spread momentum is rising and this is confirmed by the yield itself trading above its 9-month MA. Red highlights tell us when the KST is falling and the yield is trading below its 12-month MA. Black highlights reflect a conflict between the momentum of the ratio and the yield relative to its MA.
Chart 1 — Government 20- to 30-year Yield versus Government/Baa Momentum 1940 – 1982
Chart 2 — Government 20- to 30-year Yield versus Government/Baa Momentum 1981 – 2020
Related Article: Intermediate Food Model
