Please note we now only sell eBooks. Click the book you are interested in purchasing and you will be taken directly to the publisher’s site for your purchase.
Pring’s Technical Analysis Explained, Fifth Edition is listed as one of the —
World Book Day: 15 best books on investing, capital markets and trading
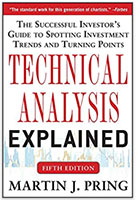
Technical Analysis Explained, Fifth Edition: The Successful Investor’s Guide To Spotting Investment Trends And Turning Points
-
-
-
-
- Published: December 23rd 2013
- Edition: 5
- ISBN: 9780071826556
- Publisher: McGraw-Hill
- Format: eBook
Regular Price:$75.00
Your Price: $60.00
-
-
-
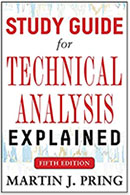
Study Guide For Technical Analysis Explained Fifth Edition
-
-
-
-
- Published: December 23rd 2013
- Edition: 5
- ISBN: 9780071826556
- Publisher: McGraw-Hill
- Format: eBook
Regular Price:$75.00
Your Price: $60.00
-
-
-
Martin Pring’s Introduction To Technical Analysis, 2nd Edition
Considered by many to be the “Bible” of technical analysis, in its 800 pages, Technical Analysis Explained, Fifth Edition: The Successful Investor’s Guide to Spotting Investment Trends and Turning Points is a comprehensive guide to help you understand and apply the core concepts as well as trading psychology and market mechanics to help you understand the why’s of trading, not just the how’s. Great for any level technician; novices will find it easy to read and understand. More experienced technician’s will find a plethora of new information and reinforcement.
Tens of thousands of individual and professional investors have used the guidance in this book to grow their wealth by understanding, interpreting, and forecasting significant moves in both individual stocks and entire markets. This new edition streamlines its time-honored, profit-driven approach, while updating every chapter with new examples, tables, charts, and comments that reflect the real-world situations you encounter in everyday trading.
Packed with hundreds of questions that correspond to chapters and sections throughout the book, Study Guide for Technical Analysis Explained, Fifth Edition, features:
- Charts and graphs to help you visually digest the concepts presented
- Full text answers to guarantee your complete understanding of each important idea
- Fill-in-the-blank, multiple-choice, and matching question formats
- The straightforward, no-nonsense style that made Technical Analysis Explained a classic
Technical analysis mastery isn’t easy, but its financial rewards make it indispensable. Use Study Guide for Technical Analysis Explained to reach the next level of technical analysis education and ensure that you start every trading day with the skills you need to come out on top.
“The technician’s technician” (Barron’s), Martin Pring gives new traders the tools and insight they need to draw greater profits from today’s markets
This new edition of Introduction to Technical Analysis explains how to evaluate trends, highs, lows, price/column relationships, price patterns, moving averages, and momentum indicators for a contemporary audience, using fully new, updated charts, diagrams, and examples.
Pring uses his trademark expertise and engaging writing style to simplify concepts for traders. Links to an exclusive downloadable video featuring original content and in-depth explanations of the material is also included.
You’ll learn how to:
- Research and construct instantly valuable charts of stock and market activity
- Interpret the basic concepts of momentum, and apply the theory to actual trades through a common sense set of trading strategies
- Use price and volume pattern to identify breakouts
- Analyze and act on peaks and troughs that can signal a change in the prevailing trend
- Calculate moving averages and gauge their impact.


